시각화도구
파이썬에는 다양한 시각화 도구가 존재한다. 강의를 보니 다양한 그래프를 간단간단하게 설명하고 넘어가는데 기본적인 구조만 기억하고 나머지는 필요할 때마다 찾아볼 생각이다.
matplotlib
pyplot객체를 사용해 데이터를 표시해준다. pyplot객체에 그래프들을 쌓은 다음 flush해서 화면에 보여준다. pyplot의 함수들이 고정된 argument가 없어서 무엇이 들어가는지 잘 찾아보고 써야한다.
1
2
3
4
5
6
import matplotlib.pyplot as plt

x = range(100)
y = [value**2 for value in x]
plt.plot(x,y) # pyplot에 그래프를 하나씩 쌓는다고 생각하면된다.
plt.show() # flush 한번 화면에 출력된 뒤 지워짐

plot는 line그래프이기 때문에 쌍을 지키지 않으면 아래처럼 무자비한 그래프가 나온다.
1
2
3
4
5
6
7
8
9
import matplotlib.pyplot as plt
import random

x = range(100)
y = [value**2 for value in x]
x_2 = [random.randint(1, 100) for _ in range(100)]
plt.plot(x,y)
plt.plot(x_2, y)
plt.show()
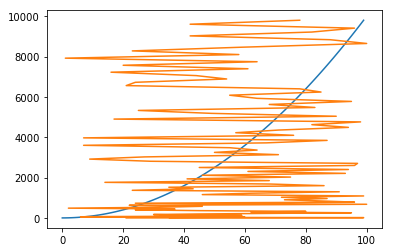
x가 증가되는 순서로 되어 있어야한다.
pyplot 구성
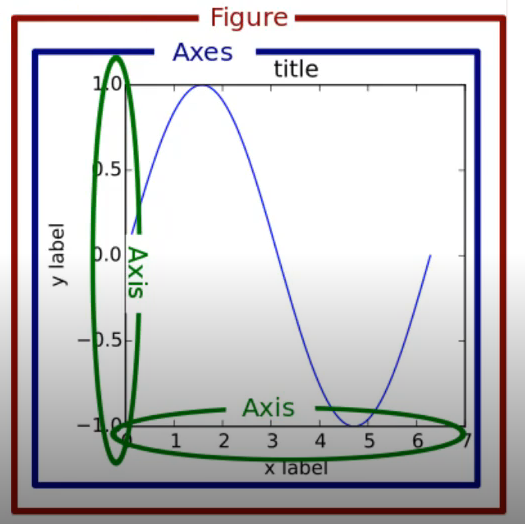
pyplot에는 Figure가 있고 Figure위에 여러개의 Axes로 구성되어 있다.
여러개의 plot그리기
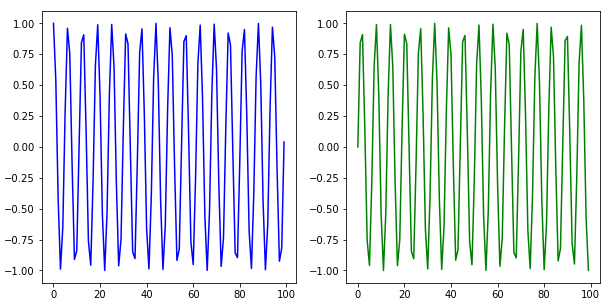
Figure객체를 받아 figure의 크기를 지정할 수 있고, 이 figure에 여러개의 plot를 올릴 수 있다.
add_subplot의 parameter는 raw, col, index느낌으로 이해하면 될것같다.
figure에 raw x col 모양의 서브 plot가 존재하고 그 중 index번째의 axis를 받아오는것이다.
1
2
3
4
5
6
7
8
9
10
11
12
13
14
15
import matplotlib.pyplot as plt
import numpy as np

x = range(100)
y_1 = [np.cos(value) for value in x]
y_2 = [np.sin(value) for value in x]

fig = plt.figure() # Figure 반환
fig.set_size_inches(10,5) # figure의 크기 지정
ax_1 = fig.add_subplot(1,2,1) # 두개의 plot생성 raw, col,
ax_2 = fig.add_subplot(1,2,2)

ax_1.plot(x, y_1, c="b")
ax_2.plot(x, y_2, c="g")
plt.show()
1
2
3
4
5
6
7
8
9
10
11
12
13
14
15
import matplotlib.pyplot as plt
import numpy as np

x = range(100)
y_1 = [np.cos(value) for value in x]
y_2 = [np.sin(value) for value in x]

fig = plt.figure() # Figure 반환
fig.set_size_inches(10,5) # figure의 크기 지정
ax_1 = fig.add_subplot(4,4,1) # 두개의 plot생성
ax_2 = fig.add_subplot(4,4,6)

ax_1.plot(x, y_1, c="b")
ax_2.plot(x, y_2, c="g")
plt.show()

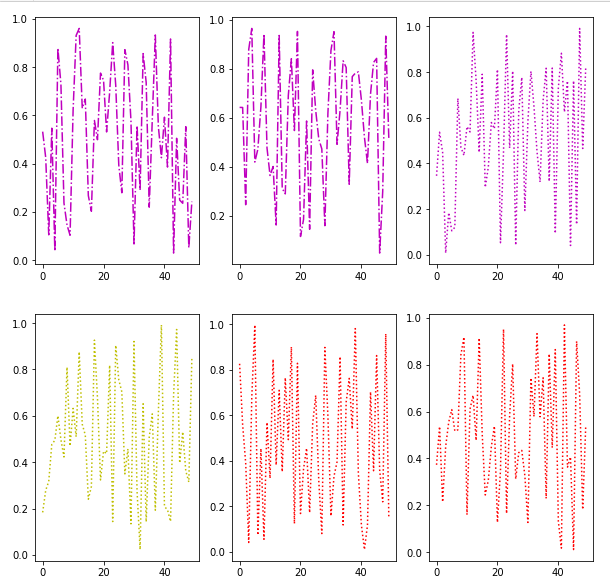
리스트와 반복문을 사용해 여러개의 plot 그리기
1
2
3
4
5
6
7
8
9
10
11
12
13
14
15
16
17
18
import matplotlib.pyplot as plt
import numpy as np

fig = plt.figure()
fig.set_size_inches(10,10)

ax = []
colors = ["b", "g", "r", "c", "m", "y", "k"]
lines = ["solid", "dashdot", "dotted"]
for i in range(1, 7):
    ax.append(fig.add_subplot(2,3,i))
    x = np.arange(50)
    y = np.random.rand(50)
    c = colors[np.random.randint(1, len(colors))]
    line = lines[np.random.randint(1, len(lines))]
    ax[i - 1].plot(x, y, c=c, ls = line) # c, color로 색을 ls, linestyle로 줄 모양을 지정할 수 있다.
plt.title("test")
plt.show()
범례, label
1
2
3
4
5
6
7
8
9
x = np.arange(50)
y_1 = [val**2 for val in x]
y_2 = [val/2 for val in x]

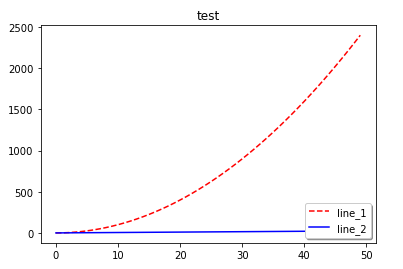
plt.plot(x,y_1, color="r", ls="dashed", label="line_1")
plt.plot(x,y_2, color="b", label="line_2")
plt.title("test") # plot의 제목지정
plt.legend(shadow=True, fancybox=True, loc="lower right") # 범례 표시(오른쪽 아래)
plt.show()
plot스타일 변경하기
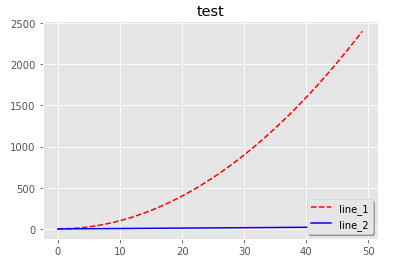
plt.style.use(“ggplot”)을 작성해주면 위의 그래프가 아래처럼 이쁘게 출력된다. 찾아보면 다양한 스타일이 있으니 상황에 따라 필요한것을 사용하면 된다.
grid, xlim, ylim
1
2
3
plt.grid(True, lw=0.4, ls="--", c=".90") # 격자를 그린다. 격자의 두깨, 스타일 투명도 지정
plt.xlim(-100,100) # 화면에 출력되는 x,y 범위 지정
plt.ylim(-100,100)
파일 저장하기
1
2
plt.savefig("test.png", c="a") # 주의할점은 show를하면 flush되어 그래프가 없어지므로
															 # show하기 전에 save해야한다.
다른 그래프들
scatter (산전도)
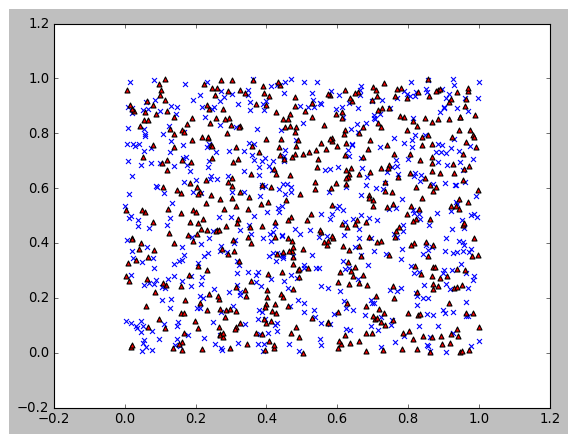
scatter를 만들 때 size를 정할 수 있다. 데이터와 같은 개수의 sequence자료를 주어야하며 boubble차트를 만들 때 사용한다.(필요할 때 찾아보자)
1
2
3
4
5
data_1 = np.random.rand(512,2)
data_2 = np.random.rand(512,2)

plt.scatter(data_1[:,0], data_1[:,1], c="b", marker="x") # x, y, 색, 모양
plt.scatter(data_2[:,0], data_2[:,1], c="r", marker="^")
histogram
1
2
3
4
  plt.style.use("classic")
  x = np.random.normal(0,100, 1000)
  plt.hist(x, bins=10) # bins의 개수만큼 그려진다.
  plt.show()
![matplotlib10]()
boxplot
1
2
3
  data = np.random.randn(100, 5)
  plt.boxplot(data)
  plt.show()

seaborn
통계적인 데이터 시각화에 많이 사용한다. matplotlib를 더 쉽게 사용할 수 있게해준다(wrapper).
보통 sns로 alias한다.
1
2
3
4
5
6
7
8
9
10
11
12
13
import numpy as np
import pandas as pd
import matplotlib.pyplot as plt
import seaborn as sns

sns.set(style="darkgrid")

tips = sns.load_dataset("tips") # seaborn에서 제공하는 data
fmri = sns.load_dataset("fmri")
sns.lineplot(x="timepoint", y="signal", data=fmri)
# data에는 pandas dataframe을 넣어주고, x,y에 column이름을 넣어주면 된다.
# hue로 카테고리컬 데이터를 넣으면 해당 카테고리별로 나누어서 그래프를 보여준다.
# sns.lineplot(x="timepoint", y="signal", hue="event", data=fmri)
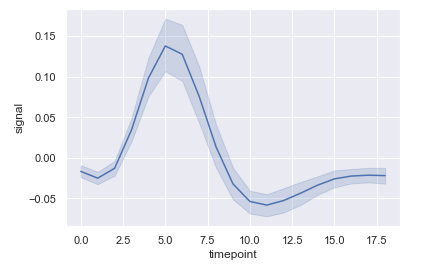
데이터를 정렬해서 평균과 분포까지 그려준다.
scatterplot
1
sns.scatterplot(x="total_bill", y="tip", data=tips)

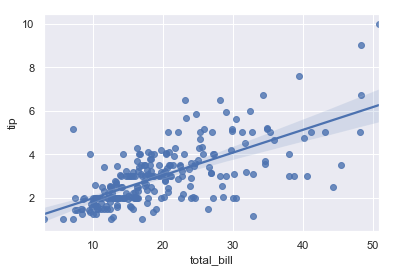
regplot
선형회귀 라인을 그려줌
1
sns.regplot(x="total_bill", y="tip", data=tips)
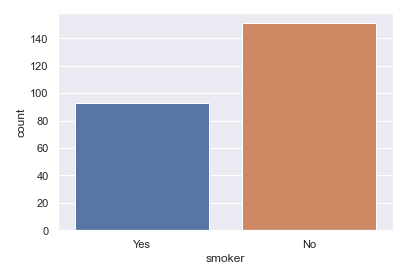
countplot
카테고리별 개수를 그래프로 보여준다.
1
sns.countplot(x="smoker", data=tips)
barplot
카테고리별 y를 그래프로 보여준다.
1
sns.barplot(x="smoker",y="total_bill", data=tips)

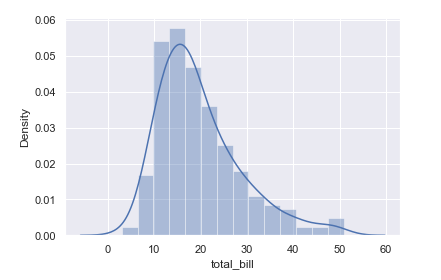
distplot
1
sns.distplot(tips["total_bill"])
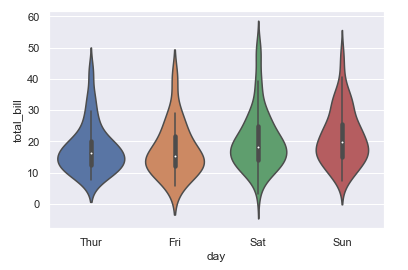
Violinplot
boxplot에 분포를 함께 표시
1
sns.violinplot(x="day",y="total_bill",data=tips)
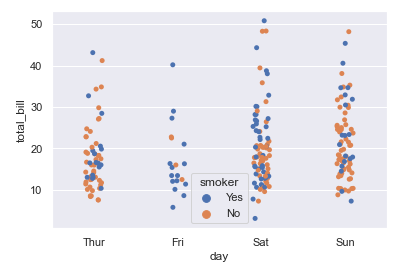
Stripplot
scatter와 category정보를 함께 표현
1
sns.stripplot(x="day",y="total_bill",hue="smoker",data=tips)
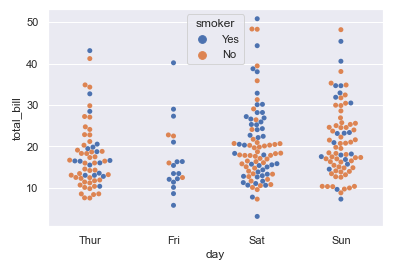
swarmplot
분포와 함께 scatter를 함께 표현
1
sns.swarmplot(x="day",y="total_bill",hue="smoker", data=tips)
